
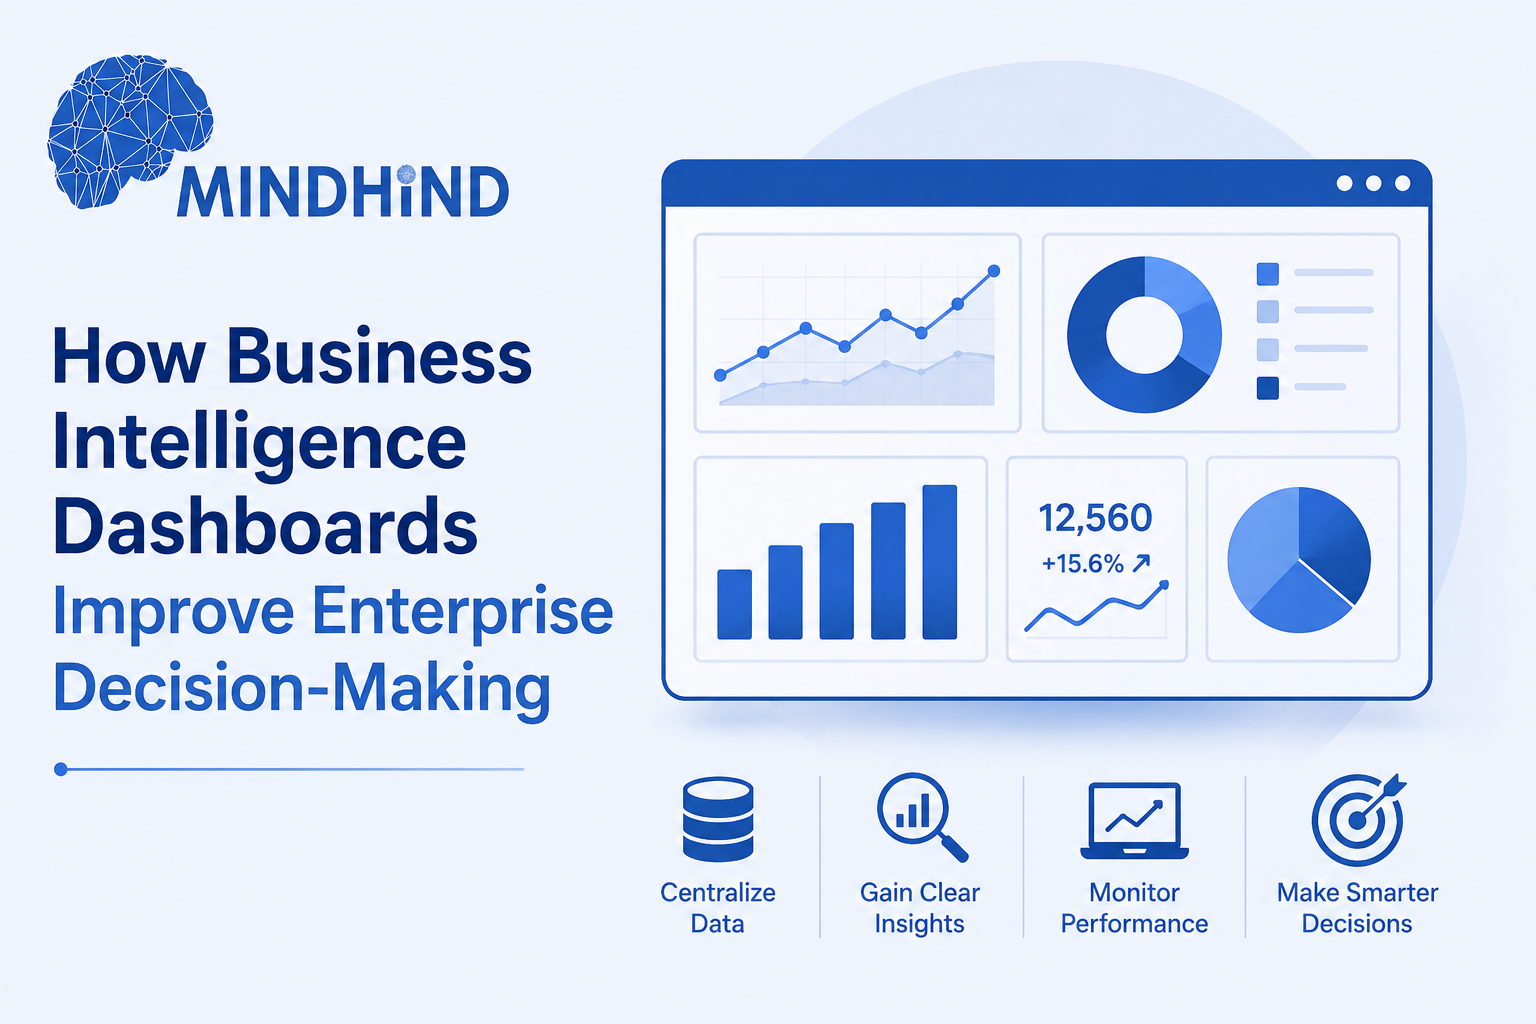
Businesses generate data across sales, finance, marketing, operations, customer service, supply chains, and digital platforms. However, decision-makers often struggle to access consistent information because reports are spread across different systems, spreadsheets, and departments.
Business intelligence dashboards bring important metrics into one centralized view. They help leaders monitor performance, identify problems, compare results, and make decisions using current business data rather than delayed manual reports.
A well-designed dashboard does more than display charts. It turns complex data into clear, actionable information that supports faster and more confident decision-making.
Centralizing KPIs and Reducing Manual Reporting
Many organizations depend on teams to collect data manually, update spreadsheets, and prepare reports for weekly or monthly reviews. This process can be time-consuming and may produce inconsistent results.
A real-time analytics dashboard automatically collects and updates information from connected systems. Leaders can monitor sales performance, revenue, customer activity, inventory, campaign results, service levels, and operational efficiency without waiting for separate reports.
Dashboards also create a shared source of information across departments. Finance, sales, operations, and management teams can review the same approved metrics instead of working with different versions of the data.
Effective enterprise reporting helps businesses identify performance issues early. A sudden drop in conversions, increase in delivery delays, or rise in customer complaints can be detected before it becomes a larger problem.
Automated reporting also allows employees to spend less time preparing data and more time analysing results and improving performance.
Planning Useful and Role-Based Dashboards
Successful BI dashboard development begins with understanding who will use the dashboard and which decisions they need to make.
Senior leaders may need a high-level view of revenue, profitability, growth, risk, and operational performance. Sales managers may need pipeline value, conversion rates, lead response times, and forecast data. Operations teams may focus on inventory, production, fulfilment, and service levels.
Each dashboard should include a limited number of meaningful KPIs. Adding too many charts can make the information difficult to understand and reduce its usefulness.
Metric definitions should also be consistent. For example, all teams should use the same method for calculating revenue, conversion rates, customer retention, or operational costs.
Role-based access ensures that users only see information relevant to their responsibilities. Sensitive financial, employee, and customer data should be protected through appropriate permissions.
Improving Data Quality and Visualization
A dashboard is only as reliable as the data behind it.
Before creating dashboards, businesses should review data sources, remove duplicates, correct errors, standardize formats, and define ownership. Poor-quality data can produce misleading charts and lead to incorrect decisions.
Visualization choices should make information easier to understand. Bar charts may be useful for comparisons, line charts for trends, and scorecards for tracking targets. Colours, labels, filters, and layouts should be used consistently.
Dashboards should highlight important changes rather than simply displaying large amounts of information. Alerts can notify users when performance moves above or below defined limits.
Working with experienced data visualization consulting specialists can help businesses select the right metrics, connect data sources, improve reporting structures, and design dashboards that support real decisions.
MindHind’s Data Analytics and Business Intelligence services help organizations centralize performance data, automate reporting, and develop role-based dashboards.
Evaluate whether your decision-makers have timely access to consistent, accurate, and actionable performance information across the business.
